Something odd is going on in the shires. Halfway through round three of the County Championship and we’ve already seen 25 centuries and 46 fifties (increasing as I write). Odd, in that the dominant narrative wherever you look is that the England’s Men’s Test side has a batting crisis and that the culprit is the standard of County Cricket.
At first glance, the criticism is not unfair; averages in the County Championship over the last five years or so have been low, hovering just above the 25 mark for all players and around 30 for those in the usual specialist batting positions of one to six.
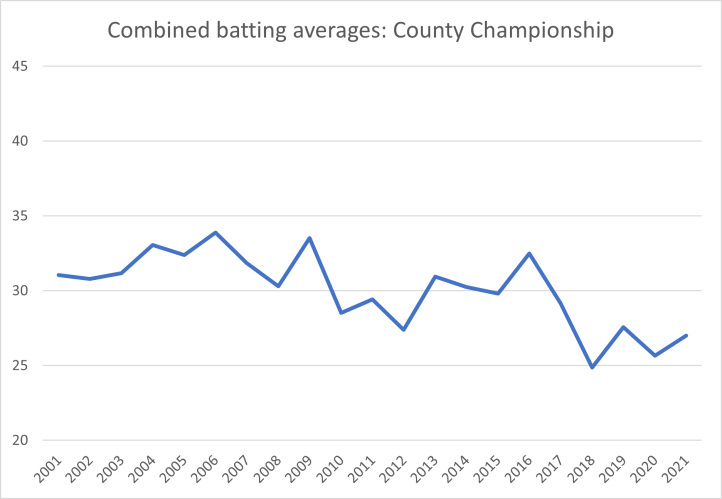

The suggested reasons for this are wide and varied: the ECB focus on shorter forms of the game and the rewards on offer for white-ball specialists; the over-use of April and May for Championship games (though the numbers don’t support the contention that batting averages are consistently lower in those months); the near absence of current international players, English and overseas, for young players to test their mettle against; the limited pipeline of school-age talent. I’ve no doubt missed plenty more.
However – and not to diminsh the very important issues that these arguments raise – there might be another factor. Might we just be having a bit of a lull?
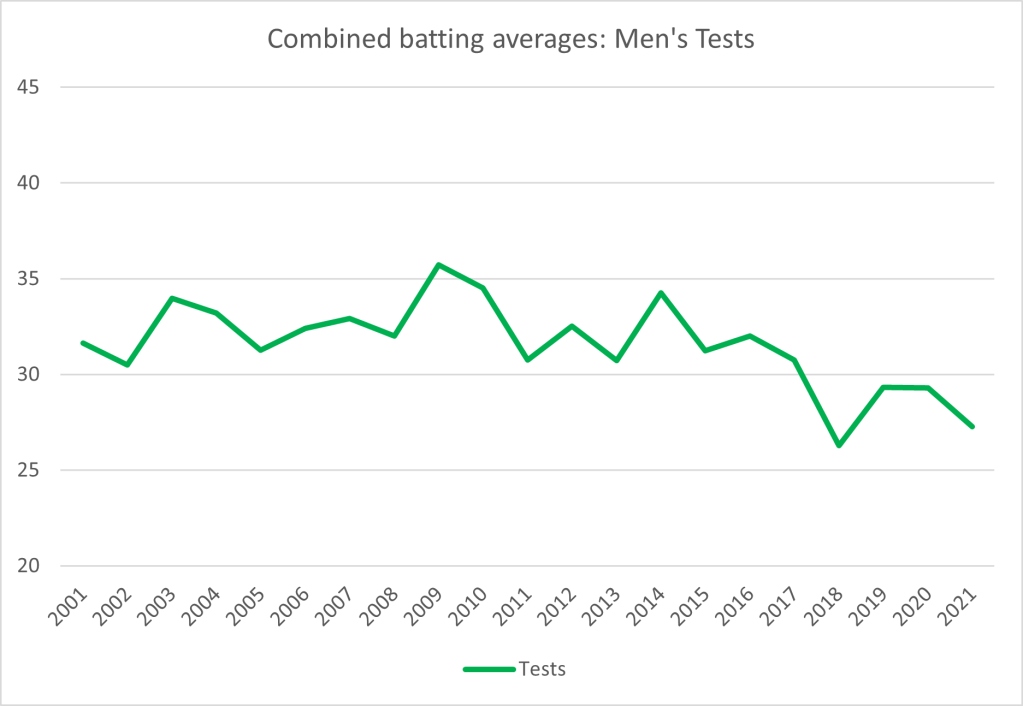
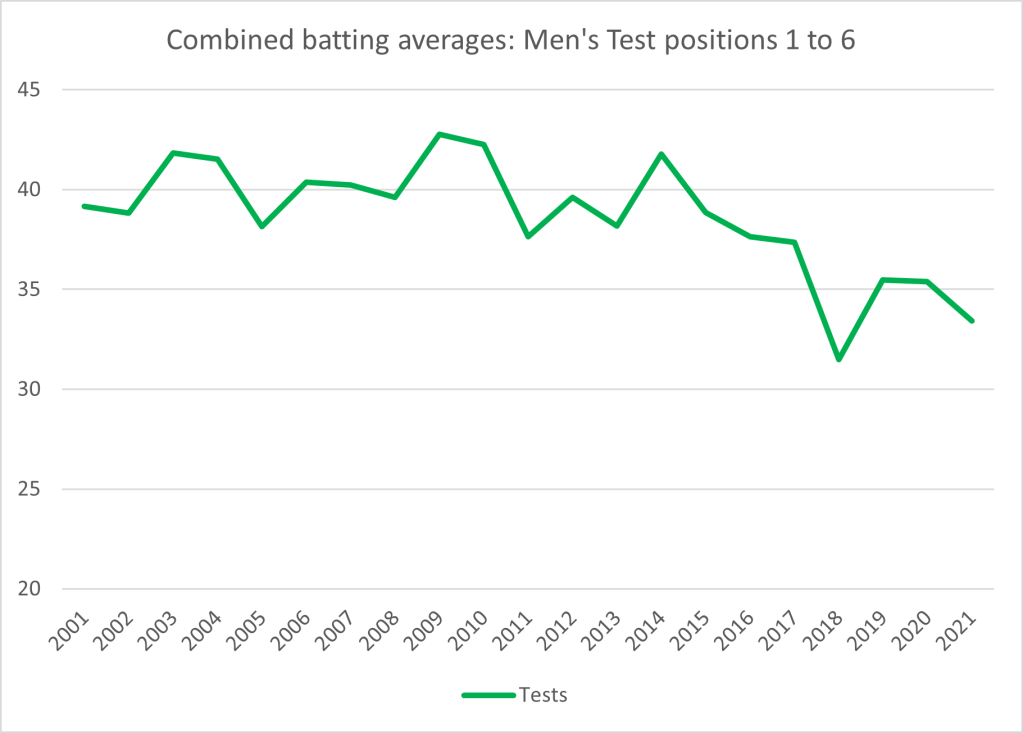
If you ever read or listened to any of Jarrod Kimber’s work (and it is highly recommended) one of the themes regularly returned to is that, in Test cricket at least, the pendulum swings between bat and ball. There are eras where batters are dominant and others where the bowlers are on top in the world game. In the 2020s, we are in one of those latter periods. Across all Men’s Test matches batting averages have been on the slide since the mid 2010s and quite dramatically so when looking at those batting in the first six positions.
The thing is, if you compare these with the County Championship averages, there is a striking similarity.
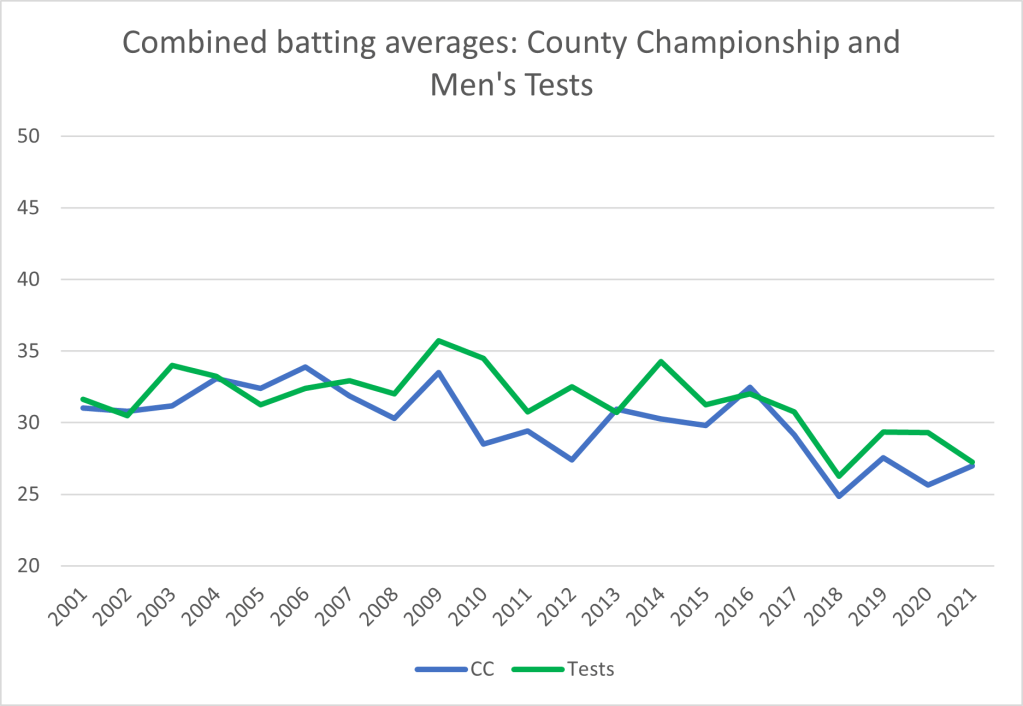

Statistically speaking there is a strong positive correlation between the batting averages of County and Test cricket in each year: 0.67 for all players and 0.71 for the top positions (0 would show no relationship between the sets of numbers; 1 would be a perfect correlation).
Could it be that the struggles of County batters in recent times are simply reflecting the fact that we are in an era where ball is dominating the bat everywhere in red-ball cricket? That the calls to take a sledgehammer to the County structure in an attempt to secure a healthy supply of top order batters is looking in the wrong place?
The problem is that it is impossible to judge the quality of the batting talent being produced by the Counties in isolation. When do you pin high or low scores on poor or good bowling, or flat or lively pitches rather than a lack of technique or application? Evidence to defend or attack County cricket can always be found to support your pre-existing position.
Advocates of fundamental change will point to the recent struggles of England’s Men’s top order who, Joe Root aside, seem incapable of anything other than the odd flash-in-the-pan innings. Can we mitigate this by the general downslope of Men’s Test scores across the board?
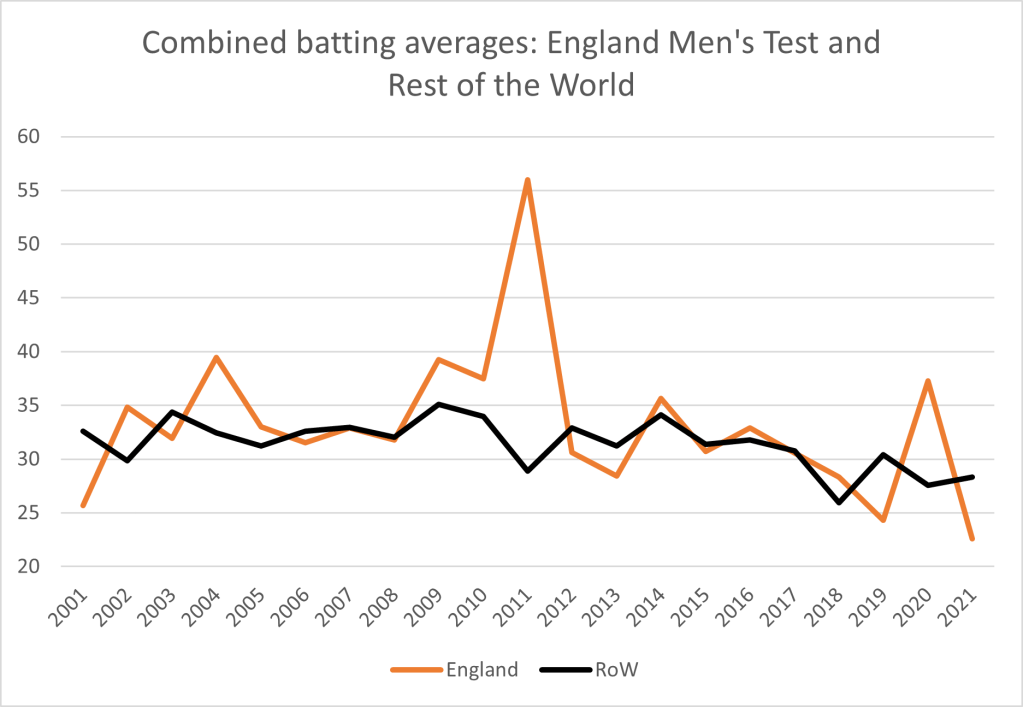
Possibly, but here the case is not so clear. There has been a similar decline in averages since 2014 but England’s performances have been much more erratic over the last twenty years and, looking at the specialist batters, other than a brief spike in Covid-impacted 2020, consistently below the other nations since 2012. The correlation between averages of England and the rest of the world at Men’s Test level for the whole team comes out at 0.06 and at 0.24 for the top six; i.e. non-existent and very weak. England’s averages seem to dance to their own tune.

That also appears to be true when looking for any connection between batting performances at County Championship and England Test level. This is strange as the Test team draws its talent from the Counties and we are currently being told that the answer to England Men’s batting issues is to restructure the domestic game. You would expect the equation to be a strong County Championship equals a strong Test team, yet the correlation between the two sets of averages sits below a weak 0.3 for both whole team and positions one to six.
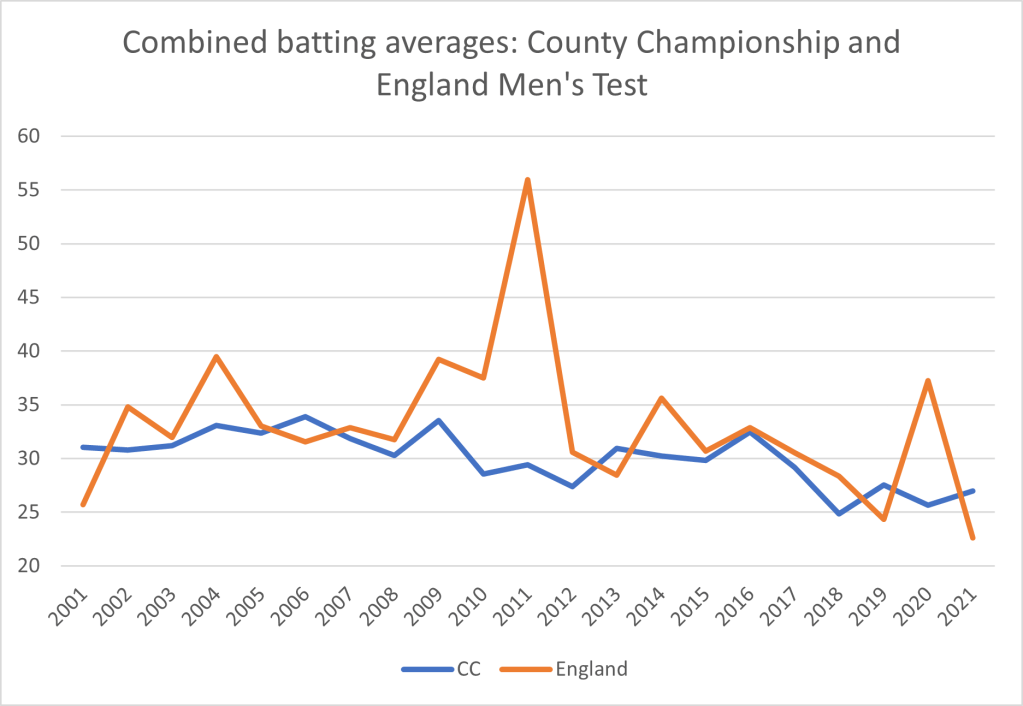

But, you will no doubt say, the cause and effect would not be instantaneous. This is true, and bulding in a lag of up to five years between the numbers does boost the correlation but only to moderate strength (up to 0.51 when comparing Test averages to County numbers of five years before).
So, if the batting performances in the County Championship can only partially explain the strength of England’s Test batting, what else can be going on? Perhaps the focus should be more on the Test set-up itself: who is selected, who gets a run in the side even if not racking up a score, when batters are ready to be dropped, the man-management, the coaching. When the Counties are examined, maybe the questions should more be around how to allow batters to experience the type of pitches and bowling styles that are seen at Test level than divisional structure and number of teams. After all, 18 Counties in two divisions were there when England went to the top of the Test rankings in 2011. The key issues might just lie elsewhere.
